SharePoint Online: How Develop Analytics for SharePoint Online using POWER BI

In this article we discuss to use data stored in SharePoint Online Site to develop analytics using PowerBI.

Here is the architecture diagram to understand it in a better way:

1

For details on this architecture you can visit: POWER BI ANALYTICS POWERED BY R INTEGRATION

In order to start with this demo, we will start with two lists namely Products & Product Category having some test data to work with as shown below:

12

Now launch the PowerBI desktop

3

Click on Get Data -> More…

4

From “Online Services” category select “SharePoint Online List”

Click “Connect”

5

Specify the URL of SharePoint Online Site

Click OK

6

Select “Product” & “Product Categories” from Navigator

Click Load to load the data in the memory of report designer

7

Let the designer query the list metadata and build cache

8

Under Fields section we can “Product” & “Product Categories” added to the designer

9

Right Click on Product List and Select “Edit Query” to modify the query for fetching the data from lists

10

In the Query Editor, click on “Choose Columns” Menu -> Choose Columns

11

Select the desired columns and from the list to be included into the report. This step is useful from performance point of view as well so always try to include only relevant columns in the query

Click OK

12

We get the new result set updated based on the query modifications

13

Now modify any of the available lookup fields or Composite fields like URL in SharePoint to include the required property into the final result set

Click on the icon next to “Product Url” as indicated below

14

Select required properties like I am selecting “Url” and deselecting “Description”

Make sure you select “Use original column name as prefix” so that new property name generate based on the original column name

Click OK

15

Once we are done we are done with the modification we can see a new column appears with the name “Product Url.Url”

16

Once all the changes have been made click “Close & Apply” command button in the ribbon

17

Wait till the query changes have been saved successfully

18

Once all the changes have been saved we can see the selected query fields under “Fields” section

19

Now we establish Parent Child Relationship between “Products” & “Product Categories” list

Click “Manage Relationships” option from the Ribbon

20

On the “Manage relationships” screen Click “New” to add a new relationship between “Products” & “Product Categories” list

21

Select Primary Key & Foreign Key Columns on the “Create Relationship” screen as shown below

Select “ProductCategoryId” column from “Products” List as Foreign Key and “Id” column from “Product Categories” List as Primary Key

Also select “Cardinality” as required as “Many to one”

Once done click “Ok” to complete the process

22

And we can be able to see the new relationships created as shown below.

Click “Close” to close the “Manage Relationship” dialog

23

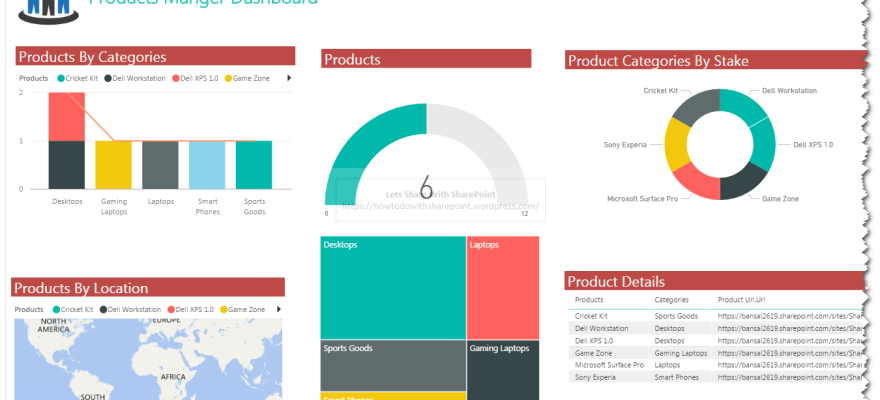
Once this is done we can develop reports using any available visualizations as highlighted below-

24

Here is the sample dashboard that I have developed based on the data available in SharePoint Lists

25

Hope you find it helpful.

Power BI Analytics Powered By R Integration

In this article we will have discussion and demo on how to integrate “R” scripts with “PowerBI” using PowerBI R Connector.

In order to utilize this article you should some basic understanding with R Programming.

Before getting into demo lets discuss the concept using following Solution Architecture Diagram-

1

Data Sources Layer shows few of the available data source that I have tested this solution with

Data Crawlers & Connectors Layer shows a generic set of Data Connectors provided by Reporting Engines and Custom Crawlers.

CSV Raw Data Sources shows the set of output files that can be used as input files by R APIs

R Programming Interface shows the R APIs and & Packages that can be utilize to perform statistical operations on the incoming data and generated a meaningful output.

Computed/Analytical Data Output shows the Output files generated by R APIs

Reporting Engines shows a couple of famous reporting engines that can be utilized to develop reports based on the input received from R APIs

In this demo I am not covering the Crawl process since there is nothing new about it. I am considering a CSV Raw Data Source is available to be consumed by R APIs as shown below-

In this raw data source we have some data related to the File Shares. It is showing number of files that are available within each file share for a specific quarter.

2

Now the scenario is to consume this data for developing trend analysis report and the obvious problem is that it is not in desired format to be consumed directly reporting engine.

That’s where we are utilizing R Programming Language which is quite in fashion these day and is well known for its Statistical Capabilities.

Though I am not displaying any hefty R Code here but rest assured you are all free to take this data transformation up to any level as per your requirements.

In the following R snippet I am reading data from CSV Files and group it based on the Quarter Column to display quarter wise Files Count.

3

For example this could be helpful if we need to develop some trend analysis on sizing capabilities of a disk.

You can see the outcome of this script as highlighted below-

Column “Group.1” shows Quarters & Column “x” shows total number of files per quarter

4

Once the R script is ready and validated we can start designing report using any of the report designers support R connectors or if they don’t we can save the R output as CSV/Database file and can feed the report designer with this output.

For this demo I am using PowerBI and interesting thing about it is having inbuilt R connector for rendering R scripts with in the report designer.

  • Launch Power BI desktop application

5

  • Click on Get Data Menu -> Click on More…

6

  • Select “Other” category of available connectors
  • Select R Script connector under “Other”
  • Click Connect

7

  • Paste the R Script in the script designer
  • Click OK.

8

As soon as script designer able to parse the script, it will show you all the possible outputs that were stored in R Variables inside the script

  • Select source as required
  • Click Load to load the required data source in designer memory

9

In the report designer we can see data source and its related fields listed under Fields section as highlighted

Under Visualizations we can see the possible Charts/Graphs available to design the dashboard.

Choose as per requirement and design the report

10

Here is demo dashboard that I have developed using this data source.

11

The important take away from this demo is to understand the right selection of technology and possibility of technology fusion to get desired output.

Hope you find it helpful.